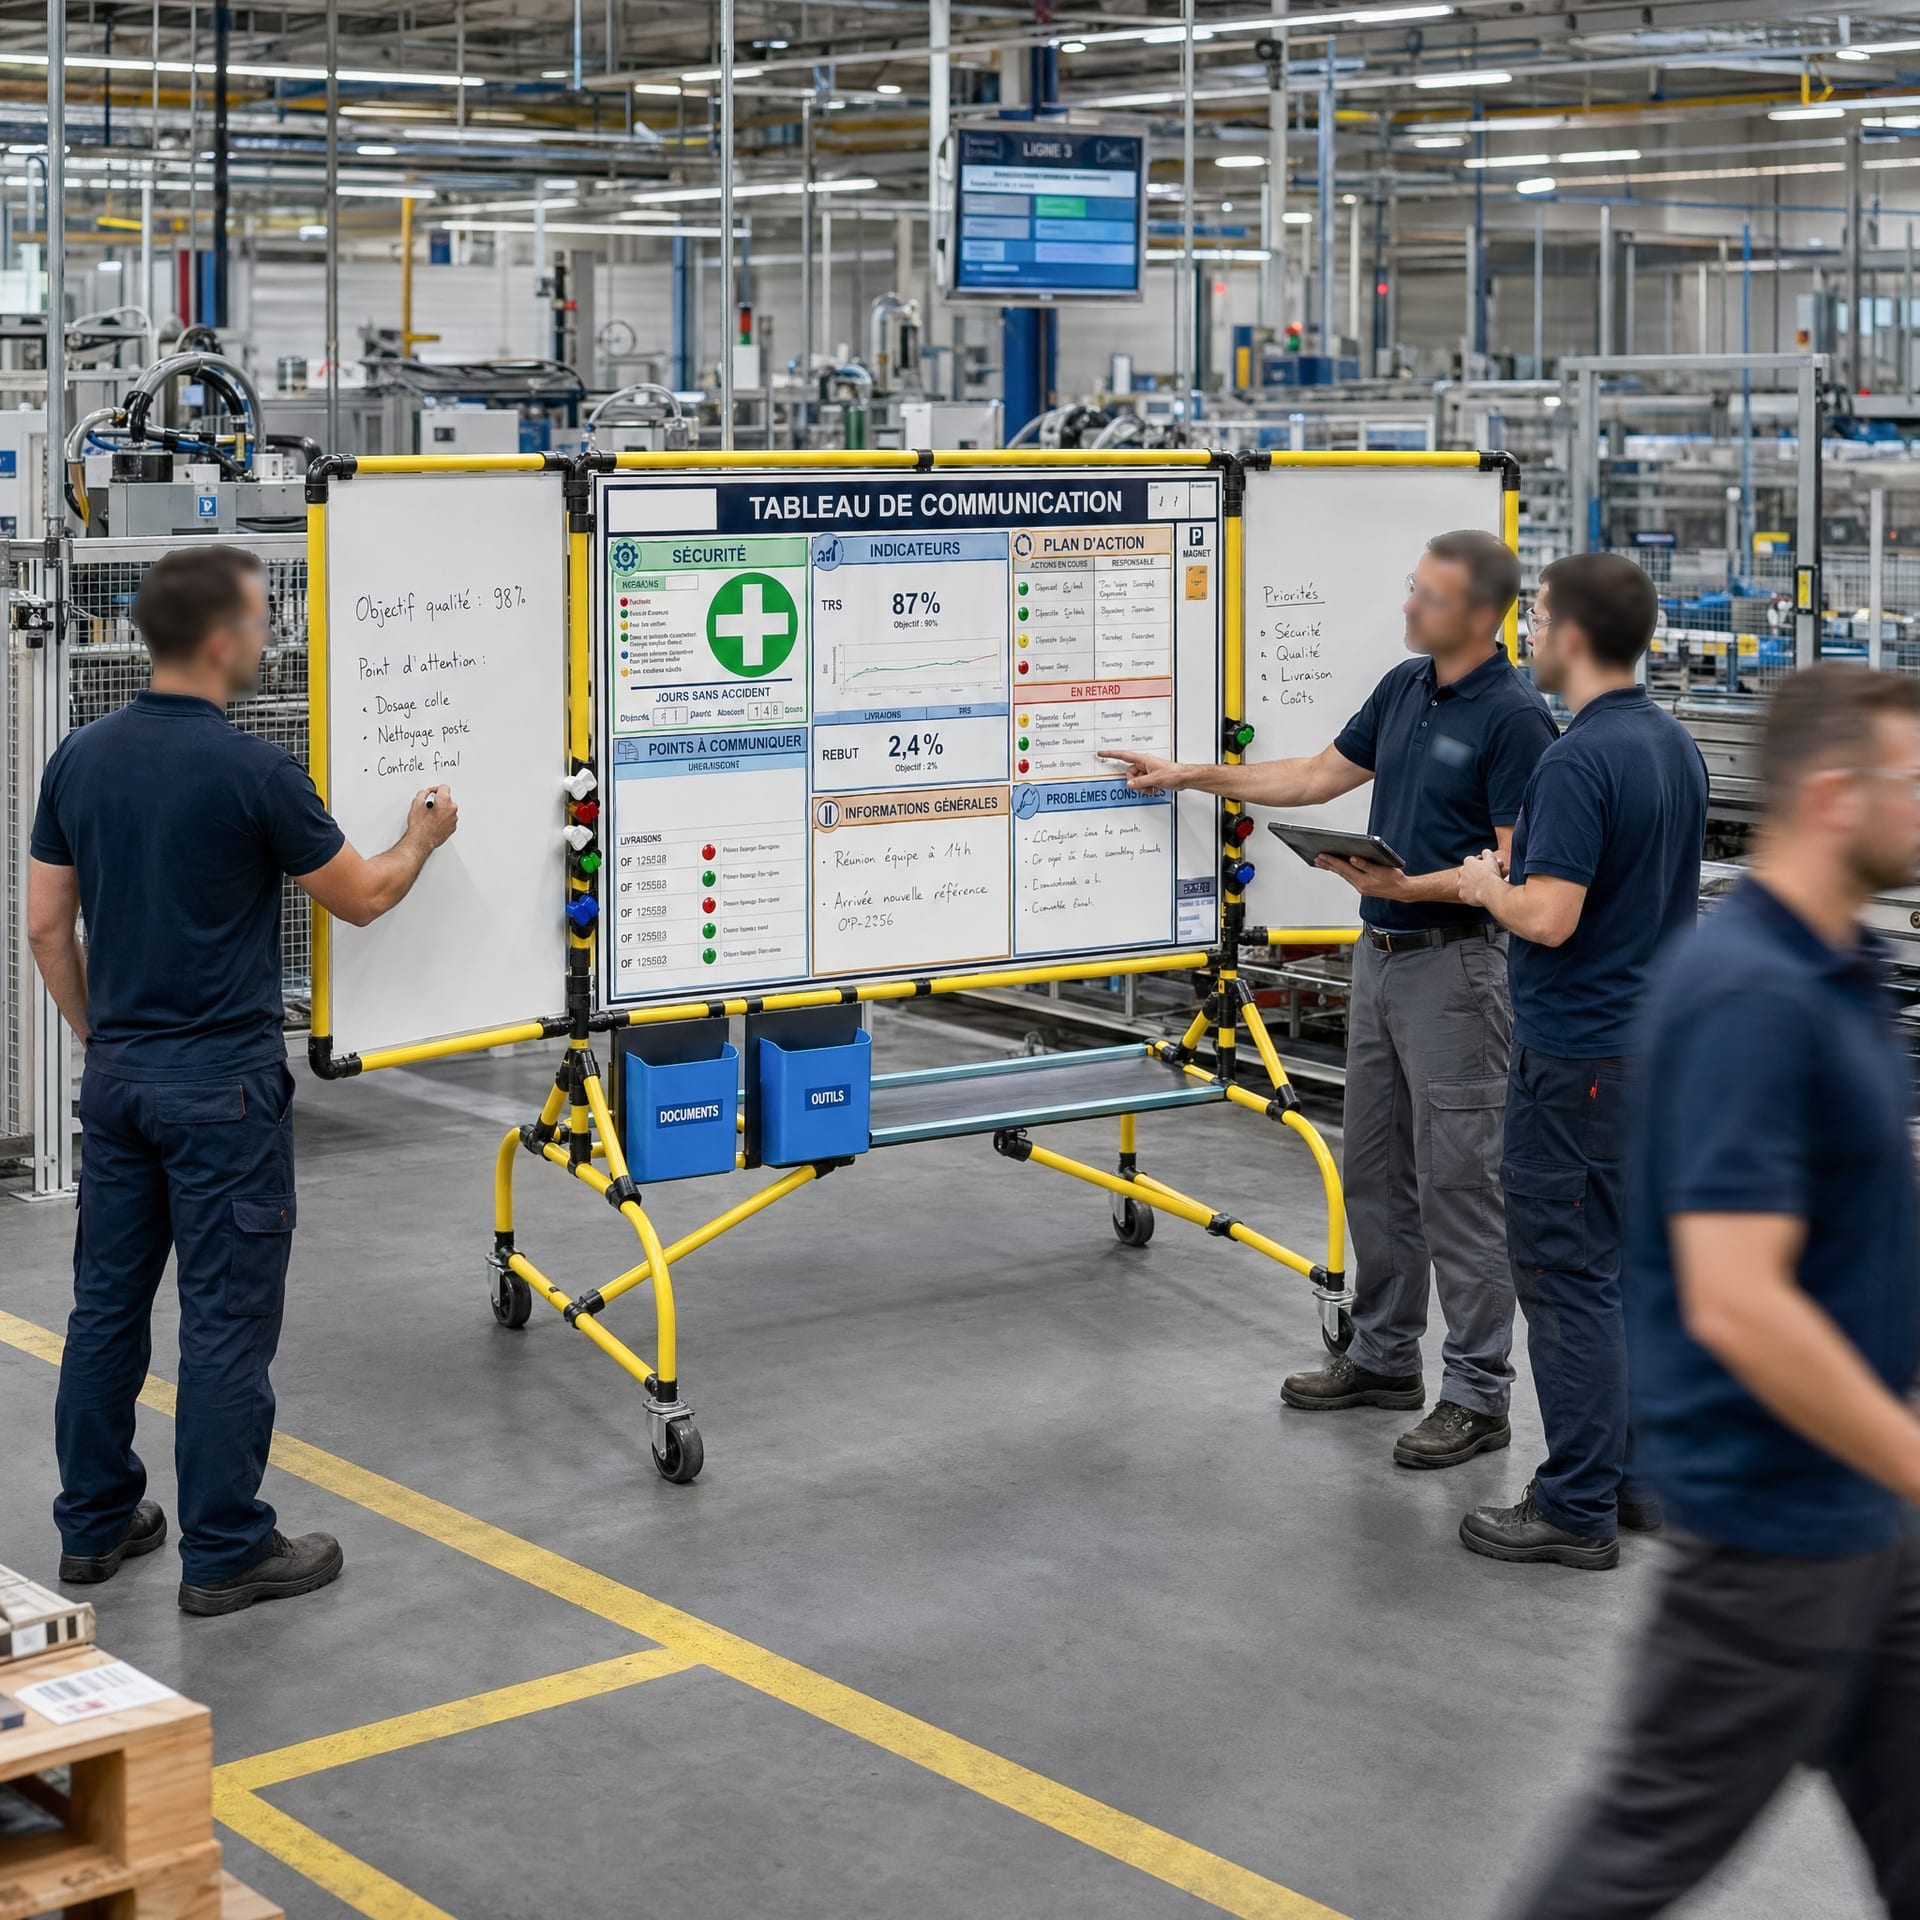
Visual management: run your workshop at a glance
When every operator sees the goal, the gap and the action to take without having to ask, your production changes pace. Visual management turns information into decision, and the shop floor into pilot of its own performance.
On 80% of industrial sites, critical information doesn't arrive in time where it's needed.
Before visual management, information lives in screens, spreadsheets and heads. After, it lives where the decision is made: on the shop floor.
The workshop endures its own fog
- The team lead chases info between the ERP and the line
- The operator doesn't know if they're on target before end of shift
- Quality drifts settle in silently over 2 to 3 days
- Weekly 1h meetings replace real-time action
- Disruptions last 3× longer for lack of early detection
The shop floor runs in real time
- Indicators visible at the workstation, no back-and-forth to the office
- The operator self-regulates to the displayed pace
- The gap to the standard is obvious from the very first hour
- Daily 10-minute huddles replace top-down meetings
- Andon triggers the right escalation in less than 2 minutes
The 3 pillars of visual management
Born from the Toyota Production System, visual management makes the real state of a process instantly understandable (no software, no question, no delay). Everything rests on three layers of visibility.
01
Make the standard visible
The right work method, the right location, the right quantity, the right sequence. Without a displayed standard, there's no detectable deviation.
02
Make the gap visible
Performance indicators, andon alerts, color codes on stocks and lead times. The gap is immediately obvious, both from the workstation and from the aisle.
03
Make the action visible
Posted action plans, named owners, visible deadlines. The gap leads to a decision, held by the team, not forgotten in an email.
Not to be confused with 5S. The 5S method organizes and standardizes the workspace; visual management runs the performance that takes place in it. The two reinforce each other and are ideally deployed in parallel on the same pilot line. To run the flows passing through these workstations, see also the Kanban method.
What visual management changes, concretely
−40%
time lost searching for info
Data available at the workstation, no more back-and-forth.
×3
responsiveness to disruptions
Andon turns a 45-min stop into a 12-min intervention.
+15-25%
OEE on pilot lines
Issues better handled, drifts detected early, huddles effective.
−50%
production meeting duration
10-min daily huddle at the board replaces 1h/week in a meeting room.
Beyond the numbers
Shop floor autonomy. Operators make decisions they didn't dare make for lack of information.
Stronger engagement. Seeing the impact of one's work in real time transforms motivation.
Faster onboarding. A newcomer understands the site's rhythm within a few hours.
Easier customer audits. A workshop where performance is visible inspires confidence: a real commercial asset.
Continuous improvement culture. A visible gap becomes a natural PDCA opportunity.
Fewer conflicts. Debate is about displayed facts, not feelings.
Deploy visual management in 5 steps
A successful rollout doesn't start with buying boards. It starts with defining what you want to see, and why. Click each step for details.
Map the information needs
For each zone (workstation, line, workshop, site), identify who needs which information, at what frequency, to make which decision. This work avoids visual management's #1 pitfall: displaying a lot, running little.
Golden rule: 3 to 5 indicators maximum per zone. Beyond that, attention dilutes and the system loses its effectiveness.
Deliverables
- Information × decision-maker × frequency matrix
- 3 to 5 KPI maximum per zone
- Definition of the standards to display
- Validation with team leads
Modular supports that evolve with your approach
Most visual management projects fail for a simple reason: the supports installed at the start can't adapt to system changes. Our modular tubular structures are designed precisely for this use case.
Custom huddle boards
Carrier structures configurable to the exact dimensions of your zone. Later modules added without full disassembly.
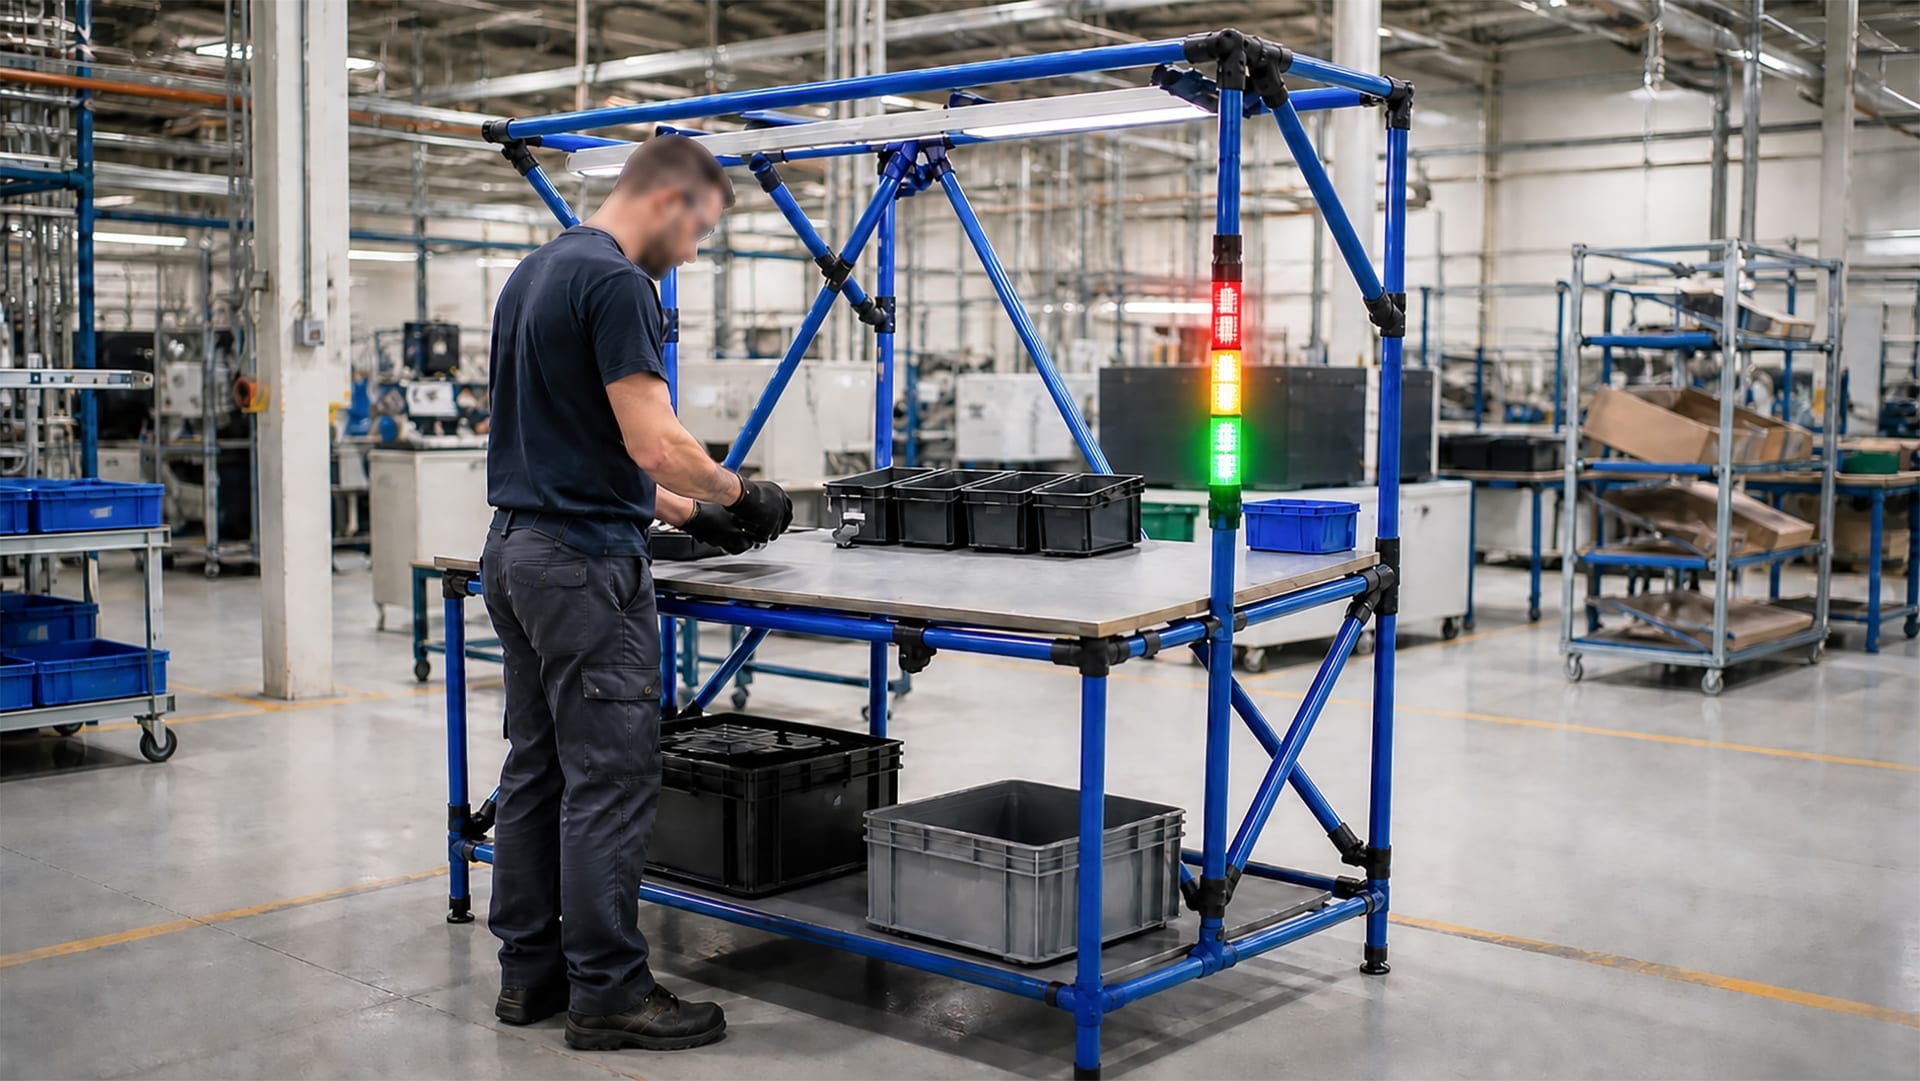
Mobile andon supports
Alert towers on tubular structure, movable from one line to another as needed. Ideal for pilots.
Shop floor KPI boards
Pilot stations sized for team rituals, ergonomic height for standing animation.
Floor marking and signage
Flow identification, buffer stock signaling, visual coherence across the full workshop.
Why modularity changes everything. A MKL tubular structure is modified in 30 minutes by an in-house operator, no welding, no cutting, no outside intervention. Your visual setups follow the evolution of your standards, not the other way around. Modular Kanban boards, indicator boards and tool shadow boards: everything reconfigures in a few hours.
Visual management by your industry
The principles are universal, the display priorities vary. Here's how visual management adapts to five sectors we work with regularly.
Automotive & suppliers
Takt time and quality at the workstationReal-time takt time display, 3-level andon, per-workstation PPM tracking, automatic escalation on stop > 2 min. Under IATF, visual management becomes documentary evidence.
Food & beverage
Traceability and changeoversCleaning tracking, CCP indicators (HACCP), production schedule with visualized format changes. Supports compatible with humid environments and high-pressure washing.
Aerospace
Per-unit traceability and conformityPart-by-part tracking, FAI status, configuration deviations, quality milestones. A pilot tool for high-value unit production where every part has its visible history.
Pharma & cosmetics
GMP conformity and lot releaseStatus of each lot, deviation alerts, qualification schedule, mandatory training tracking. Supports suited to bio-cleaning and controlled atmospheres.
Electronics & high-tech
First-pass yield and ESDPer-line FPY tracking, rework rate, alerts on critical process parameter drifts. Possible integration of MES-connected screens, without giving up the physical supports of the ritual.
Customer case
An automotive supplier cuts unplanned stoppages by 32% in 4 months
Context
180-person site, 4 machining lines, 2 shifts. Average OEE 68%, including 14% poorly documented unplanned stops. No daily animation ritual.
Action
Pilot line in 6 weeks: huddle board design, team lead training, mobile andon tower installation. Extension to the 3 other lines in 10 weeks.
Results at 4 months
- Unplanned stoppages−32%
- Average incident duration−58%
- Site OEE68 → 76%
- Weekly meetingremoved
What manufacturers ask us
How long does it take to deploy visual management on a line?
+Count 4 to 8 weeks for a full first deployment on a pilot line, including mapping, design, installation and launching the huddle rituals. Deploying to subsequent lines goes much faster (2 to 3 weeks) once graphic standards and standard supports are defined.Must a 5S project be finished before starting?
+No, but both reinforce each other powerfully. 5S creates the environment in which visual management becomes legible. In practice, many sites roll out both in parallel on the same pilot line.What's the difference between visual management and a digital dashboard?
+A digital dashboard displays data. Visual management generates decision on the shop floor. MES-connected screens feed visual indicators in real time, but without an animation ritual and without a physical support for gap analysis, the data stays passive. Digital serves the ritual, never the other way around.How much does it cost to set up on a medium-sized site?
+Highly variable depending on the site's size and maturity. As an indication, a full pilot-line deployment (supports + coaching + training) sits between €8,000 and €25,000. ROI is typically reached in 3 to 6 months on early OEE gains.Does visual management work in a small business (< 50 people)?
+Yes, and particularly well. The physical proximity between actors makes the daily ritual very effective. Pitfall: oversizing the setup. On a 30-person site, one well-animated board is worth more than five deserted ones.How do you align visual management with a Kanban system?
+Kanban is a specific form of visual management applied to material and WIP flows. The two work in synergy: visual management drives performance, Kanban drives flow.Which indicators should be displayed first?
+The SQCDP rule covers 90% of cases: Safety, Quality, Cost, Delivery, People. On each axis, a single indicator, updated daily, with goal and 30-day history visible. Beyond 5 indicators per board, attention dilutes.
Makitlean solutions for lasting visual management
Three support families that make information useful, visible and stable on a daily basis.
How much does each month without shop floor visibility cost you?
Our simulator gives a quantified estimate of the cost of inaction in your situation: undetected stops, quality drift, buffer overstocking. In 3 minutes, you'll know what your blind spot represents in euros per month.